Pepsales raises $1.1MNfrom Chiratae Ventures ($1BN+ AUM)
Read MoreRead More
Sales Enablement

B2B Benchmarks for SaaS Sales: What to Measure and How

Abhinandan Sahgal

and

February 20, 2025

The B2B SaaS Sales Benchmarks & Metrics Playbook (2025 Edition)

In the competitive world of SaaS, sales benchmarks are more than just numbers, they’re your compass for navigating the path to sustainable growth. Understanding how your sales team performs against industry standards enables you to:

Sales teams are the lifeline of every B2B SaaS company. While an exceptional product is critical, effective sales strategies drive growth. But how can you measure success? Are you spending too much on customer acquisition? Are your sales reps closing deals efficiently? The answer lies in tracking and aligning the right sales metrics with industry benchmarks.

Let’s explore the key benchmarks and metrics you need to monitor in 2025 for scalable success.

1. Customer Acquisition Cost (CAC)

What is it?
CAC measures the total cost of acquiring a new customer, including marketing, salaries, and tools.

Formula:

                Total Sales & Marketing Spend

CAC =   _____________________________

             Number of New Customers Acquired

Benchmark:

  • Early-stage SaaS: LTV: CAC > 3:1
  • Mature companies: Payback within 12 months

Why it matters:
If you spend $1,000 to acquire a customer worth $1,200, your strategy is unsustainable. CAC ensures your go-to-market approach remains efficient.

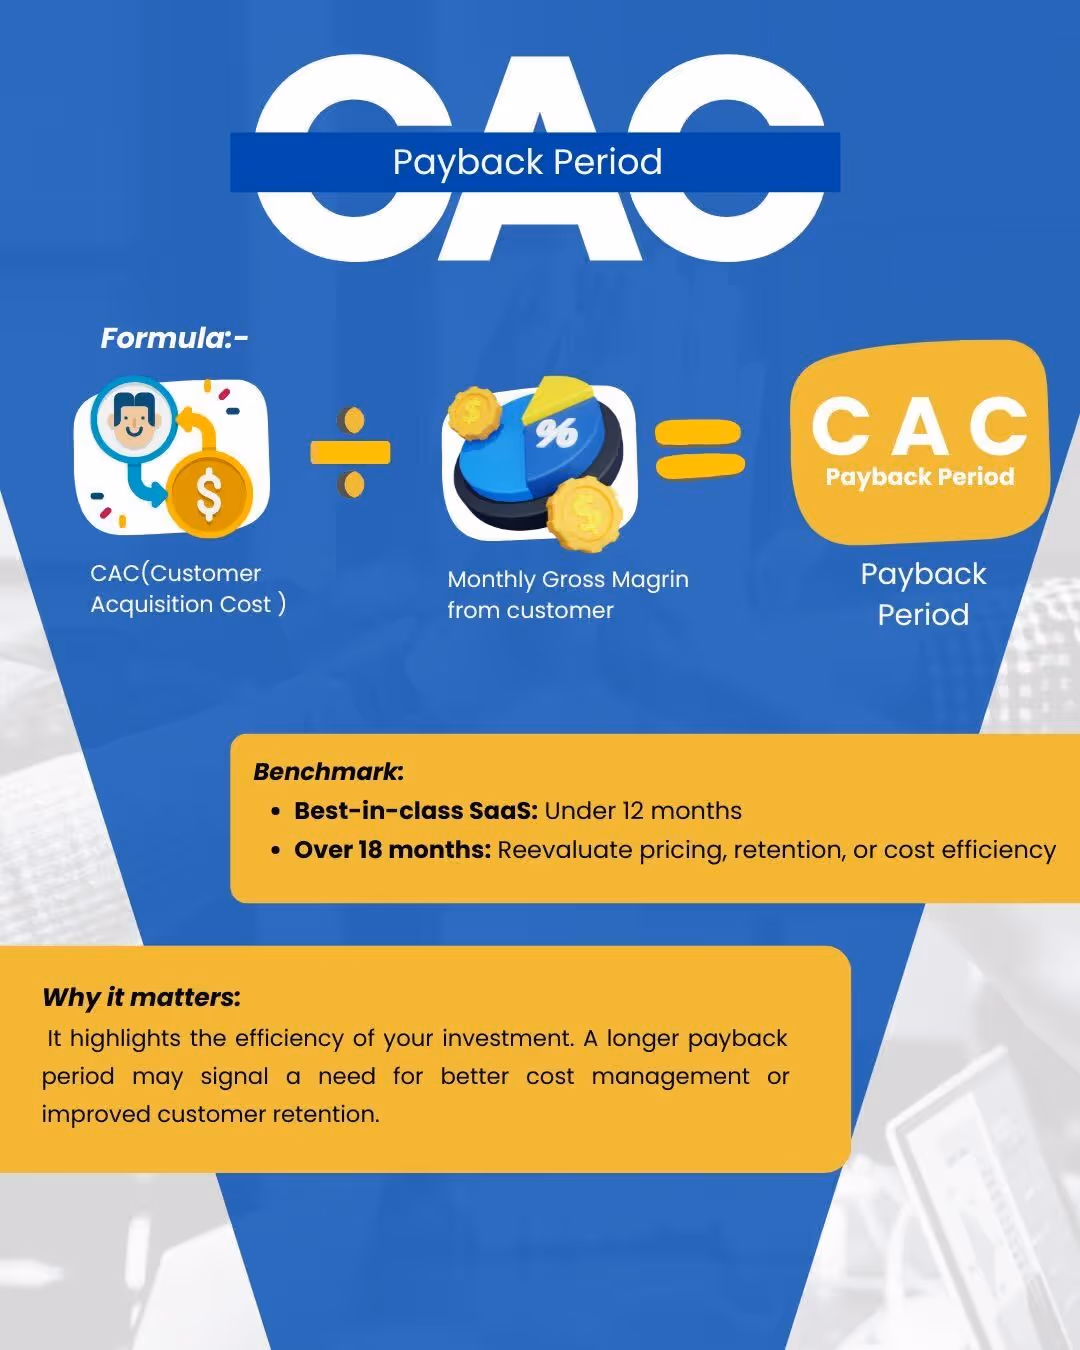
2. CAC Payback Period

What is it?
This metric tracks how long it takes to recoup your CAC through subscription revenue.

Formula:
 

                                                                 CAC 

 CAC Payback Period =      __________________________________

                                           Monthly Gross Margin from Customer

Benchmark:

  • Best-in-class SaaS: Under 12 months
  • Over 18 months: Reevaluate pricing, retention, or cost efficiency

3. Sales Efficiency (Magic Number)

What is it?
The Magic Number evaluates revenue growth compared to sales and marketing spend.

Formula:
                                             
 (Net New ARR in Quarter)

 Magic Number = _________________________________________

                                (Sales & Marketing Spend in Previous Quarter)

Benchmark:

  • < 0.5: Inefficient
  • 0.5–1: Average
  • 1: Golden standard for VC-funded companies

4. Quota Attainment

What is it?
The percentage of sales reps meeting or exceeding their quotas.

Benchmark:

  • Average teams: 60%
  • Top-performing teams: 70%+

Consistently low attainment signals issues in quota setting, training, or lead quality.

5. Win Rate

What is it?
The ratio of closed deals to total qualified opportunities.

Formula:

                            Closed-Won Deals

 Win Rate =  ______________________

                         Qualified Opportunities

Benchmark:

  • Mid-market: 20–25%
  • Enterprise: 15–20%

6. Pipeline Coverage Ratio

What is it?
The ratio of open pipeline to your sales target.

Formula:
                                     
 Total Pipeline

 Pipeline Coverage = ________________

                                             Quota

Benchmark:

  • Healthy pipeline: 3x quota
  • < 2x: High risk of missing targets

7. Ramp Time for Account Executives (AEs)

What is it?
The time it takes for newly hired AEs to hit full productivity.

Benchmark:

  • SMB AEs: 2–3 months
  • Enterprise AEs: 6–9 months

8. Average Deal Size

What is it?
The average revenue earned per closed deal.

Benchmark:

  • SMB: $3K–$5K ARR
  • Enterprise: $40K+ ARR

9. Sales Cycle Length

What is it?
The average time to close a deal from the initial interaction.

Benchmark:

  • SMB: 30–45 days
  • Enterprise: 90–180 days

10. Lead Velocity Rate (LVR)

What is it?
LVR measures the monthly growth rate of qualified leads.

Formula:

             Current Month’s Qualified Leads - Last Month’s Qualified Leads

 LVR = _____________________________________________________

                               Last Month’s Qualified Leads x 100

Benchmark:

  • Growth-stage SaaS: 10–20% MoM

Optimizing SaaS Sales with Metrics

In the competitive world of SaaS sales, data is a powerful tool. Tracking key B2B Sales Metrics like lead-to-opportunity conversion rates, win ratios, and sales cycle lengths gives teams the insights needed to make smarter, data-driven decisions. However, while metrics guide strategies, the foundation of success lies in understanding prospects' needs early in the sales process.

Tracking these metrics allows sales teams to make data-driven decisions. However, understanding prospects' needs early on is equally vital. This is where Pepsales’ Discovery Co-pilot excels.

How Pepsales' Discovery Co-pilot Enhances Sales Performance

Sales reps often lose opportunities due to poor discovery call strategies. Pepsales’ AI-powered Co-pilot suggests tailored questions, such as:

  • “What are your biggest challenges with lead conversion?”
  • “What sales tools do you currently use?”

This ensures better lead qualification and higher close rates.

Final Thoughts

Sales benchmarks are guides, not rules. Use them to inform decisions and optimize strategies, considering your unique business context. Tools like Pepsales’ Discovery Co-pilot empower teams to engage prospects effectively and drive better outcomes.

Ready to boost your sales performance? Book a demo with Pepsales AI today.

Increase your wins by
50%
and double your sales productivity.
Get a Demo
Share this blog!
https://pepsales-new.webflow.io/blog/
b2b-saas-sales-benchmarks-metrics